 钱多多量化小栈
虽然在交易日打印日志输出是可以跟踪系统的操作流程,但是人们更乐意看图片,交易和操作数据可视化更好理解交易过程。增加图形展示数据也很容易,只需要增加一行代码即可:
cerebro.plot()图形展示数据方法要在cerebro.run()执行
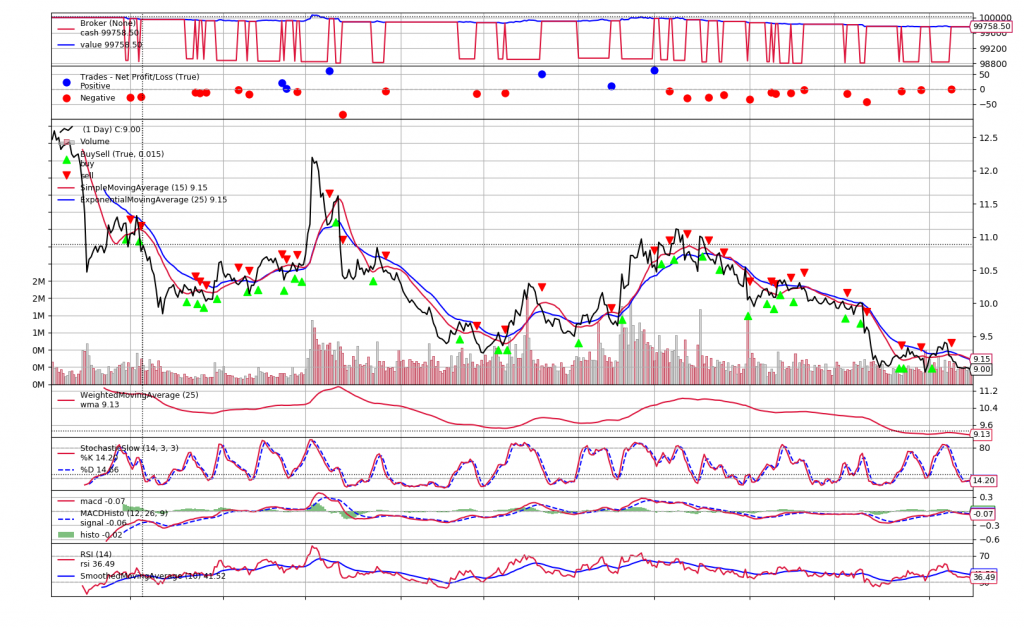
为了能更好的展示自动数据可视化,增加一些自定义的指标。指标如下:
- EMA 指数平滑移动平均线
- WMA 加权移动平均线
- SLOWKD KD快慢指标
- MACD 指数平滑异同移动平均线
- RSI 相对相若指标
- SMA 简单移动平均线
- ART 平均真实波幅
在Strategy类的init方法中增加对应的指标
# Indicators for the plotting show
bt.indicators.ExponentialMovingAverage(self.datas[0], period=25)
bt.indicators.WeightedMovingAverage(self.datas[0], period=25).subplot = True
bt.indicators.StochasticSlow(self.datas[0])
bt.indicators.MACDHisto(self.datas[0])
rsi = bt.indicators.RSI(self.datas[0])
bt.indicators.SmoothedMovingAverage(rsi, period=10)
bt.indicators.ATR(self.datas[0]).plot = False
全代码
输出
qtbt\data\stockinfo.csv.tmp removed!
Starting Portfolio Value: 100000.00
2020-02-26, Close, 11.20
2020-02-26, BUY CREATE, 11.20
2020-02-27, BUY EXECUTED, Price: 11.20, Cost: 1120.00, Comm 1.12
2020-02-27, Close, 11.21
2020-02-28, Close, 10.85
2020-02-28, SELL CREATE, 10.85
2020-03-02, SELL EXECUTED, Price: 10.95, Cost: 1120.00, Comm 1.09
2020-03-02, OPERATION PROFIT, GROSS -25.00, NET -27.21
2020-03-02, Close, 11.04
......
2021-09-15, OPERATION PROFIT, GROSS 1.00, NET -0.84
2021-09-15, Close, 9.19
2021-09-16, Close, 9.12
2021-09-17, Close, 9.11
2021-09-22, Close, 9.03
2021-09-23, Close, 9.03
2021-09-24, Close, 9.02
2021-09-27, Close, 9.02
2021-09-28, Close, 9.03
2021-09-29, Close, 9.02
2021-09-30, Close, 9.00
Final Portfolio Value: 99758.50
生成图片